프로젝트를 하면서,
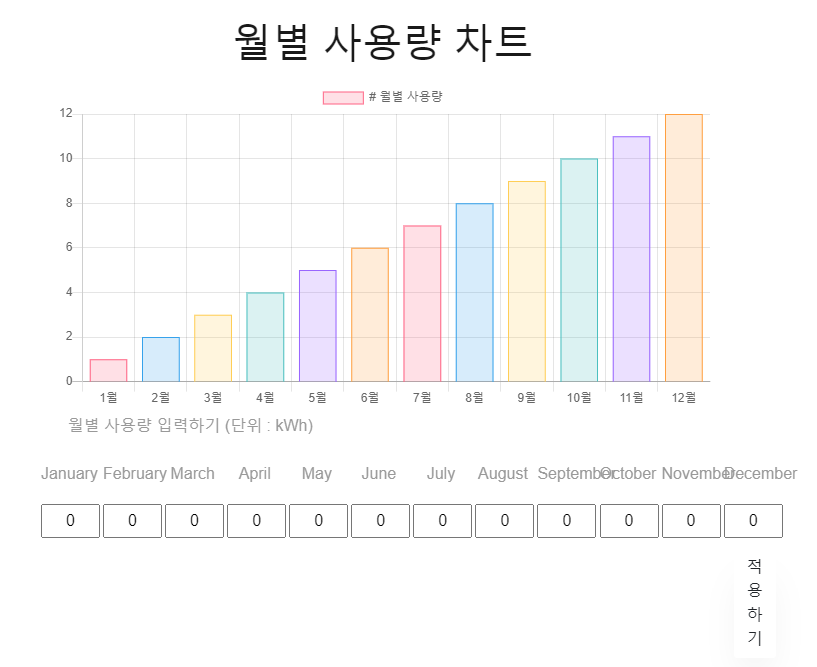
회원별로 월별 사용량 차트를 기록했다.
회원별이므로 마이페이지에서 볼 수 있도록 구현하였다.
차트는 부트스트랩을 이용하였다.
코드는 다음과 같다.
// 차트 그리기
var ctx = document.getElementById('myChart');
var myChart = new Chart(ctx, {
  type: 'bar',
  data: {
    labels: ['1월', '2월', '3월', '4월', '5월', '6월', '7월', '8월', '9월', '10월', '11월', '12월'],
    datasets: [{
      label: '# 월별 사용량',
      data: [1, 2, 3, 4, 5, 6, 7, 8, 9, 10, 11, 12],
      backgroundColor: [
        'rgba(255, 99, 132, 0.2)',
        'rgba(54, 162, 235, 0.2)',
        'rgba(255, 206, 86, 0.2)',
        'rgba(75, 192, 192, 0.2)',
        'rgba(153, 102, 255, 0.2)',
        'rgba(255, 159, 64, 0.2)' ,
        'rgba(255, 99, 132, 0.2)',
        'rgba(54, 162, 235, 0.2)',
        'rgba(255, 206, 86, 0.2)',
        'rgba(75, 192, 192, 0.2)',
        'rgba(153, 102, 255, 0.2)',
        'rgba(255, 159, 64, 0.2)' ,
      ],
      borderColor: [
        'rgba(255, 99, 132, 1)',
        'rgba(54, 162, 235, 1)',
        'rgba(255, 206, 86, 1)',
        'rgba(75, 192, 192, 1)',
        'rgba(153, 102, 255, 1)',
        'rgba(255, 159, 64, 1)',
        'rgba(255, 99, 132, 1)',
        'rgba(54, 162, 235, 1)',
        'rgba(255, 206, 86, 1)',
        'rgba(75, 192, 192, 1)',
        'rgba(153, 102, 255, 1)',
        'rgba(255, 159, 64, 1)',
      ],
      borderWidth: 1
    }]
  },
  options: {
    scales: {
      yAxes: [{
        ticks: {
          beginAtZero: true
        }
      }]
    }
  }
});
function cha(){
  var count = 0;
  var month_array = ['inputJan','inputFeb','inputMar','inputApr','inputMay','inputJun','inputJul','inputAug','inputAug','inputSep','inputOct','inputNov','inputDec'];
  for (const i of month_array){
    myChart.data.datasets[0].data[count] = document.getElementById(i).Value;
  }
}
월별이므로 1월부터 12월까지 데이터를 배열로 집어 넣었다.
우리의 목표는 회원이 달마다 입력을 하여,
입력 된 값이 데이터가 저장이 되어, 후에 다시 로그인을 하여도 데이터가 남아있도록 하였다.
(새로고침하여도 이미 입력한 데이터는 그대로 계속 남아 있음)
프로젝트 마감기한 시간상, 여러 달을 하고싶었으나,
1년만 차트로 표현을 할 수 있도록 하였다.
후에, 매년 할 수 있도록 구현을 하면 좋을 것 같다.
차트는 회원 계정별 차트이므로 그에 맞는 데이터를 불러와야한다.
chart부분의 views.py
def chart(request):
  if request.user.is_authenticated:
    author = str(request.user)
    user_author = Chart.objects.values('author') #modey.py의 오브젝트중 author(유저 닉네임부분)을 가져오는곳
    a = 0
    for i in user_author: #가져오는 데이터 QuerySet을 가져오고 list로 변환하여 담는부분
      if list(i.values())[0] == author:
        a = list(i.values())[0]
    chart_test = Chart.objects.filter(author = a)
    chart_list = serializers.serialize('json', chart_test)
    context = {
      'chart_list' : chart_list
    }
    return render(request, 'chart.html', context)
  else:
    return render(request, 'login.html')
현재 로그인된 정보를 author로 담았다.
db에서 로그정보를 가져와서 비교한 후, 회원에 맞는 차트를 가져와서
json으로 변환을 해주었다.
json으로 리턴된 데이터를 받아야하지만, js로 바로 보내는 방법을 잘 모르겠어서
return render(request, 'chart.html', context)위와 같이 html로 반환되기 때문에
chart.html에
<input type="hidden" id="chart" value= "{{ chart_list }}">이렇게 숨겨놓은 코드로 chart_list의 값을 확인하였다.
이 값을 사용하기 위해서, value로 넘긴 후,
js에서
var ctx = document.getElementById('myChart');myChart부분으로 값을 다시 불러들였다.
json으로 보낸 데이터를 getElementById로 가져오니까 데이터 형식이
배열이 아닌, 문자열로 바껴서 그것을 뽑아내기 위해서
db_chart.push(a[0][a[0].indexOf(i) + 7]);코드를 작성해주었다.
데이터가 문자열이므로 현재
[jan] = 1 [feb] = 2 ~~~~~~
이렇게 저장이 되어, 숫자 7을 더하면서 jan이라는 문자열을 찾고, 거기서 칸 수인 7을 더하면 숫자가 나와
그 숫자를 불러들이는 방법으로 억지스러운 코드를 사용하였다.
원래는 웹에서 데이터를 가져오게 될 때
데이터가
data: [db_chart[0], db_chart[1], db_chart[2], db_chart[3], db_chart[4], db_chart[5], db_chart[6], db_chart[7], db_chart[8], db_chart[9], db_chart[10], db_chart[11]],
일 때, 데이터의 접근은 data[0] 으로 데이터가 접근이 되어야하는데 json형식이므로
변환을 해야하는데 그것을 하지 못해
위처럼 문자열배열로 들어가서 강제로 코드를 끌어내서 사용하였다.
이 코드를 수정을 조금 더 해보고 싶다.
html파일
<form method="POST" action ="{% url 'create' %}">
          {% csrf_token %}
          <h1 class="text-center">월별 사용량 차트</h1>

          <input type="hidden" id="chart" value= "{{ chart_list }}">


          <div class="container">
            <canvas id="myChart"></canvas>
          </div>
          <div class="input">월별 사용량 입력하기 (단위 : kWh)</div>
          <div class="parent">
            <div class="January">
              <p class="text-center">January</p>
              <input style="text-align: center;" type="text" size="2" id="inputJan" value="0" name="Jan">
            </div>
            <div class="February">
              <p class="text-center">February</p>
              <input style="text-align: center;" type="text" size="2" id="inputFeb" value="0" name="Feb">
            </div>
            <div class="March">
              <p class="text-center">March</p>
              <input style="text-align: center;" type="text" size="2" id="inputMar" value="0" name="Mar">
            </div>
            <div class="April">
              <p class="text-center">April</p>
              <input style="text-align: center;" type="text" size="2" id="inputApr" value="0" name="Apr">
            </div>
            <div class="May">
              <p class="text-center">May</p>
              <input style="text-align: center;" type="text" size="2" id="inputMay" value="0" name="May">
            </div>
            <div class="June">
              <p class="text-center">June</p>
              <input style="text-align: center;" type="text" size="2" id="inputJun" value="0" name="Jun">
            </div>
            <div class="July">
              <p class="text-center">July</p>
              <input style="text-align: center;" type="text" size="2" id="inputJul" value="0" name="Jul">
            </div>
            <div class="August">
              <p class="text-center">August</p>
              <input style="text-align: center;" type="text" size="2" id="inputAug" value="0" name="Aug">
            </div>
            <div class="September">
              <p class="text-center">September</p>
              <input style="text-align: center;" type="text" size="2" id="inputSep" value="0" name="Sep">
            </div>
            <div class="October">
              <p class="text-center">October</p>
              <input style="text-align: center;" type="text" size="2" id="inputOct" value="0" name="Oct">
            </div>
            <div class="November">
              <p class="text-center">November</p>
              <input style="text-align: center;" type="text" size="2" id="inputNov" value="0" name="Nov">
            </div>
            <div class="December">
              <p class="text-center">December</p>
            <input style="text-align: center;" type="text" size="2" id="inputDec" value="0" name="Dec">
            {% if user.is_authenticated %}
              <button type="submit" class="btn" onclick="cha()">적용하기</button>
            {% else %}
              <button type="button" class="btn" onclick="alert('로그인을 해주세요')">적용하기</button>
            {% endif %}
            </div>
          </div>
        </form>
post요청으로 들어올 때 action은 create로 넘어가면서,
create views.py
def create(request):
  author = str(request.user) # POST요청을 변수에 담는 부분
  Jan = request.POST['Jan']
  Feb = request.POST['Feb']
  Mar = request.POST['Mar']
  Apr = request.POST['Apr']
  May = request.POST['May']
  Jun = request.POST['Jun']
  Jul = request.POST['Jul']
  Aug = request.POST['Aug']
  Sep = request.POST['Sep']
  Oct = request.POST['Oct']
  Nov = request.POST['Nov']
  Dec = request.POST['Dec']
  user_author = Chart.objects.values('author') #modey.py의 오브젝트중 author(유저 닉네임부분)을 가져오는곳
  a = 0
  for i in user_author: #가져오는 데이터 QuerySet을 가져오고 list로 변환하여 담는부분
    if list(i.values())[0] == author:
      a = list(i.values())[0]
  Chart.objects.filter(author = a).update(#db값 업데이트
    Jan = Jan,
    Feb = Feb,
    Mar = Mar,
    Apr = Apr,
    May = May,
    Jun = Jun,
    Jul = Jul,
    Aug = Aug,
    Sep = Sep,
    Oct = Oct,
    Nov = Nov,
    Dec = Dec,
  )
  chart_test = Chart.objects.filter(author = a)
  chart_list = serializers.serialize('json', chart_test)
  context = {
    'chart_list' : chart_list
  }
  return render(request, 'chart.html' , context)
html에서 입력한 값들을 변수에 담아, 해당 유저의 데이터 값을 업데이트해준다.
여기서 의문점은, 저렇게 변수마다 직접 값을 받아왔는데,
배열로 하면 조금 더 쉬운 방법이 있지 않을까! 라는 생각이 든다.
적용하기 버튼을 누르면 js 에서 선언해준 cha() 함수를 실행이 된다.
function cha(){
  var count = 0;
  var month_array = ['inputJan','inputFeb','inputMar','inputApr','inputMay','inputJun','inputJul','inputAug','inputSep','inputOct','inputNov','inputDec'];
    for (const i of month_array){
      myChart.data.datasets[0].data[count] = db_chart[count];
      count++;
    }
  myChart.update();
  }
입력한 값들을 datasets의 월 별 사용량 데이터에 저장을 할 수 있도록 구현하였으며,
차트 그림이 변하는 것을 확인할 수 있다.